
Fire Foam Testing - How to Page
Main Menu
The main menu gives 4 choices for working with foam tests.
Add New Test - Creates a new test from scratch with no parameters filled in and the data set to today.
Create New Test from Existing - Creates a new test using the basic data and calibration points from a saved test. It sets the data to today.
Continue Test - Takes all of the data from a saved test and continues with that test.
View Test - a saved test can be viewed but none of the parameters can be changed or saved.
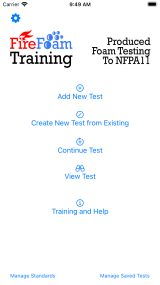
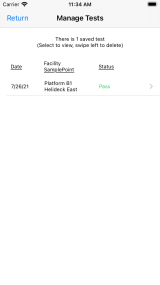
Tests can be deleted by pressing the Manage Saved Tests button and then swiping left on the test to be removed.
Standards can be added and deleted by pressing the Manage Standards button.
Pressing the gear wheel in the top left hand corner allows the Logo and Company Information to be changed.
Test Screen and Calibration Screen
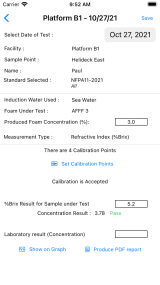
On the test screen the basic parameters can be entered. The Save button can be pressed at anytime and will save the test at the current point. For Add New Test or Create New from Existing a new test is saved. For Continue Test the existing saved test will be overwritten.
1 of 10 standards can be selected for the test pass fail criteria, user defined criteria can be entered, and 1 of 3 measurement types (Refractive Index (%Brix), Refractive Index, and Conductivity) can be used for data entry.
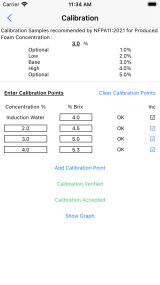
Once a Produced Foam Concentration is entered the callibation point screen can be reached. On the callibration screen points can be entered. Up to 9 calibration points can be entered.
The verification of the calibration checks if any of the points are too far away from the calibration line if they are they are marked as suspect. It should be noted that it may not be the point marked as suspect that causes the problem.
When the calibration is as required then it can be accepted. Once accepted the test sample value can be entered. When the test sample is entered a result is provided. This result is either pass, fail or amber. Amber may be a pass or a fail but it is close to the pass/fail criteria. When the sample is entered the graph and the report become available.
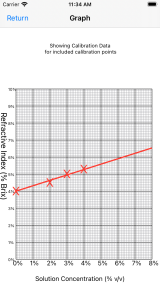
Graphs
Two graphs are available. A calibration graph which shows the calibration points and the best fit line. On the calibration screen points can be included or excluded giving the ability to get the best fit line possible.
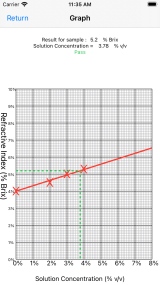
A result graph which includes the test sample from its position to the calibration line and then down to the test result.
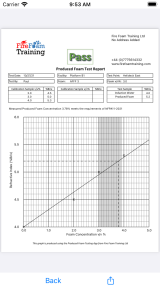
Reporting and Contact
A report can be created from a completed test as a pdf file. The pdf report can be setup to use any logo and company details. This report can then be saved, printed or emailed depending on the functionality that is available on the device that the app is running on.
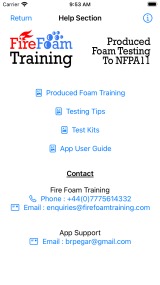
A help and training screen is available from the main menu. This gives some tips and also contact details.
Lite and Full Version
The app is downloadable from the apple store. The initial cost is free and this allows the completion/creation of 10 tests.
The full version of the app provides unlimited tests, the ability to save testsand access to the pdf reporting. Access to the full functionality can be gained using the button at the top main menu, "Lite Version". An in-app purchase is used to gain full access to the app.